The Trade-Off Between Stocks and Bonds

The Trade-Off Between Stocks and Bonds
A trader works on the floor of the New York Stock Exchange before in this file photo. Traditional indicators point to a recession but this time may be different. Mario Tama/Getty Images
James H. Nolt
Updated:
Stocks (equity) and bonds (debt) are the two major long-term financial assets typically held by investors. It is common knowledge among investors that the prices of these assets, on average, tend to go in opposite directions.
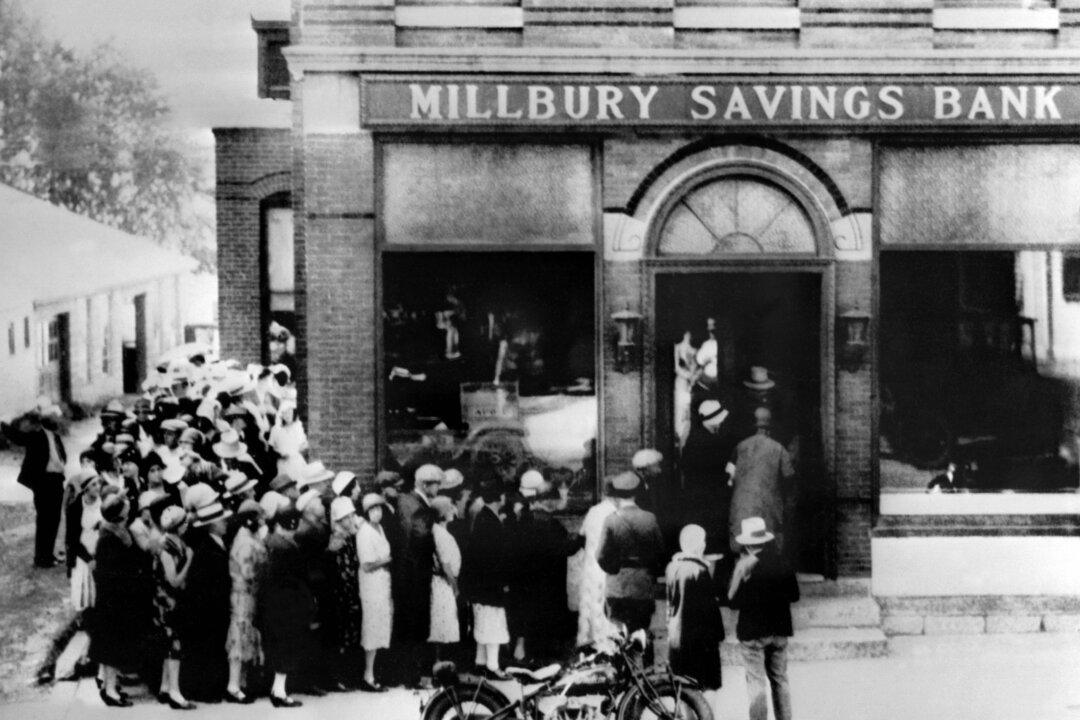
There are two recurring exceptions to this normal trade-off: Boom and bust “culminating points” (as Keynes called them) are periods when stock and bond prices are broadly correlated, rather than moving in opposite directions. So during a general financial crisis, both stocks and bonds may fall in value, wiping out considerable fortunes.
The easiest way to grasp the stock-bond trade-off is to consider them as two alternative or substitute assets purchased out of the same pool of investable funds. If investors wish to sell stocks because of concerns about falling corporate earnings or rising bankruptcy risk, they ordinarily switch their funds into bonds. On the other hand, if bond prices are likely to fall because of fears of inflation or excessive debt in relation to the income of borrowers (the issuers of bonds), thereby increasing the default risk, investors tend to sell bonds and buy stocks.
Of course, by the laws of supply and demand, increased selling pressure tends to lower prices and increased buying pressure tends to increase prices. Consider it this way: If many want to sell and few want to buy at existing prices, then prices must fall until more potential buyers believe the asset is now a good buy at the discounted price.

The Boom

During a bullish boom, most capitalists are optimistic about the future, so many expand credit in the expectation that most uses of credit will earn profit. This creates a self-fulfilling prophecy, at least for some time, because credit expands faster than real output. New net credit increases purchasing power, whether for real goods or investment assets like stocks and bonds.
The pool of investable funds is thus expanding as credit expands. With more funds available for purchasing goods and assets, prices tend to rise. Rising asset prices fulfill the prophecy, justifying with capital gains the credit used to purchase them. Credit expansion occurs in diverse forms, including bank loans, lines of credit (including consumer credit cards), issuance of bills, increasing accounts payable (sellers give their customers more time to pay), and new bond issuance (bond IPOs). As a boom takes off, stock and bond prices may both rise, reflecting the spending power of this exuberant expansion of credit.
However, the correlation of stock and bond prices begins to break down as the boom evolves into a normal expansion. With so many capitalists anticipating growth, many new projects are initiated, expanding infrastructure and factory capacity. These new projects are financed in three ways: 1) stock IPOs, 2) bond IPOs, and 3) investors (including firms themselves) selling some of their existing financial securities (stocks and bonds) to create equity in companies that are using that new equity to buy new productive machines and equipment, expanding employment and output capacity.
The first two methods increase the supply of financial assets while the diversion of investable funds to owners’ equity reduces the demand for securities. If these trends are not counteracted by new credit expanding fast enough, this increasing supply of securities and decreasing demand leads to their prices declining, or their rise slowing, like during the latter stages of the dot.com bubble.

Inflation

Thus, as the boom matures, asset inflation tends to be superseded by price inflation of real goods as demand for adding capacity pushes up prices of machinery and equipment, along with wages. Rising wages and employment also tend to increase consumer prices until new output can catch up with expanded demand.
During most expansions, bond prices tend to soften before stock prices. This represents the trend of investors rushing into shares of real assets (either stocks or owners’ equity in productive firms) to profit from real output growth. The falling value of bonds is the inverse of the rising interest rate, or the yield on bonds.
The rapid expansion of debt (which is credit viewed from the other side of the contract) tends to make investors more wary of owning debt assets relative to the soaring value of equity. Product price inflation also tends to weaken investor interest in bonds. The typical stock-bond inverse price relationship thus appears. The 1920s were a classic equity boom (and debt bubble) of this kind, also coming at a time when debt securities were abundant because of vast quantities of government bonds issued to finance World War I, plus new corporate bonds issued to finance booming corporations in new industries such as automobiles and electronics.
Many expansions continue for years, punctuated by fluctuations reflecting alternating shivers in the context of broad bullishness. Most peter out within a decade or so. The irony that kills every expansion is that the accumulation of debt and perhaps growing inflation means that debt assets become less attractive stores of wealth at the same time that continued expansion requires an ever-increasing expansion of credit.

The Bust

But credit cannot continue to expand if potential creditors expect falling bond prices. The creditors demand higher and higher interest to hold debt rather than equity assets. Rising interest rates mean that indebted firms and real estate investors must pay more and more to roll over their debts, leaving them less capital to spend on real investment in factories, productive equipment, and construction.

Demand for new capital goods starts to sag. Demand for investment tends to be more volatile than consumer spending, since consumers are more oblivious than capitalists about economic trends. When capitalists see slowing growth, there is less need to invest in expanded productive capacity. Meanwhile, as long as they have jobs, consumers just keep spending as usual.

Here is where the controversy starts. I first had this idea during my PhD dissertation research when I stumbled on the dynamics of the Japanese financial crisis of 1927. During my decades of reading and research since, I have found the pattern I saw then to be rather common. Creditors exert their power to squeeze debtors and make a profit.

Major creditors, by definition, hold most of their wealth in the form of debt assets, including bonds, bills, and loans. Yet, as creditors, they reserve the power to lend or not. On the one hand, they profit by the interest they earn issuing credit. On the other hand, if they issue so much credit that inflation begins to erode the value of their assets (nearly all debt assets are denominated in a fixed currency value), they can choose to curtail credit, forcing prices down.
Falling prices and debt deflation also hurts equity interest, which is subordinate to credit in the capital structure. Both bonds and stocks fall in tandem, but some people and companies can still profit.

1920s Japan

The 1927 crisis in Japan ended a four-year economic boom on the heels of an enormous earthquake in the Tokyo area in 1923. The devastation and loss of life were immense, but the rebuilding effort stimulated a period of vigorous growth. The world economy also was thriving at that time, termed “the Roaring ‘20s.” Japan’s textile and apparel exports took off, and the country surpassed Britain as the world’s largest cotton textile exporter by the early 1930s, soon dominating the new rayon trade as well.

The region was largely at peace. Japan was not yet deeply involved in the ongoing Chinese civil war, and enjoyed good relations with all the major powers, except the isolated Soviet Union. There was no conspicuous or universally accepted trigger event for the crisis. To most of the public, it seemed to come out of nowhere.

But beneath the surface, there was a growing polarization and divergence of strategic interests among Japanese business conglomerates, known as zaibatsu. They were bifurcated into the older zaibatsu and the structurally different, newer, more risk-taking ones. The older ones were centered on large banks and general trading companies oriented toward international trade, while the newer groups concentrated in heavy industries such as chemicals and shipbuilding that depended on tariff protection for survival because Japan was not yet internationally competitive in those products.

The biggest difference was that the older zaibatsu, led by the “Big Four” (Mitsui, Mitsubishi, Sumitomo, and Yasuda), each controlled one of the five largest banks in Japan, along with large insurance companies. They had all the financing they needed within their own groups. The newer zaibatsu, by contrast, had to borrow extensively to finance massive capital investments in heavy industries. And they borrowed almost exclusively from outsiders. Most of the new zaibatsu’s long-term financing came from government-owned development banks that favored their projects for policy reasons, including strengthening Japan’s war readiness.

Yet the capital the new zaibatsu could borrow from government banks was never enough to satisfy their growth plans. They supplemented their capital with call loans from the five largest banks. Those big banks, who distrusted excessive bullishness, would only lend to the new groups overnight loans that had to be renewed every day or loans that could be “called” at the whim of the creditor, meaning the creditor always reserved the right to cancel the loan and demand immediate repayment.

One day, the big banks controlled by the Big Four cut the credit line to their fast-rising competitors and adversaries. They demanded payment; when it was not forthcoming, they forced several of Japan’s largest new zaibatsu into bankruptcy. The Big Four profited mightily. Since many ordinary investors panicked, not knowing which banks were exposed to the failing groups, deposits flowed out of scores of lesser banks and into the biggest banks, which were believed to be safe. Within months, these biggest banks doubled their share of Japan’s total deposits to two-fifths from about one-fifth.

Furthermore, as many of the new zaibatsu were bankrupted, the Big Four were able to buy their choice of industrial and mining companies at a steep discount, eliminating competitors and enlarging their own groups. By the 1930s, Mitsui, the largest, controlled roughly 300 companies comprising about 15 percent of Japan’s total output. The Big Four together controlled almost half of Japan’s economy, including the lion’s share of its foreign trade.

Like every crisis throughout history, Japan’s 1927 crash had winners and losers. It was not just a random exogenous event, but the outcome of strategic interaction among contending parties, much like in war. The polarization that primed the country for this crisis was deeply embedded in divergent business interests and strategies, not just irrational panic.

James H. Nolt is a senior fellow at the World Policy Institute and author of “International Political Economy.”
Views expressed in this article are opinions of the author and do not necessarily reflect the views of The Epoch Times.
James H. Nolt
James H. Nolt
Author
James H. Nolt is a Senior Fellow at the World Policy Institute and author of "International Political Economy."
Related Topics