NASA: Antarctic Sea Ice Is Increasing and Arctic Ice Is Melting—Here’s Why

The ice in Antarctica is increasing while ice in the Arctic is decreasing, a study by NASA and NOAA released on May 20 says.
NASA: Antarctic Sea Ice Is Increasing and Arctic Ice Is Melting—Here’s Why
Older, rougher and thicker Antarctic sea ice in the Bellingshausen Sea in Oct. 2007, within the sea ice shield surrounding Antarctica. The ice in this region is approximately 33 feet (10 meters) thick.
Updated:

The ice in Antarctica is increasing while ice in the Arctic is decreasing, a study by NASA and NOAA released on May 20 says.

The Arctic is set for a record-breaking melt this summer, NOAA says. The agency says a snowmelt occurred on May 13 in Alaska, which makes it the earliest snowmelt in 73 years of record keeping. The new mark beats the previous 2002 record by 10 full days.

This image from April, 2016, shows recent fracturing and rotation of sea ice near Alaska and the western Canadian Arctic archipelago. (National Snow and Ice Data Center/www.nsidc.org )
This image from April, 2016, shows recent fracturing and rotation of sea ice near Alaska and the western Canadian Arctic archipelago. National Snow and Ice Data Center/www.nsidc.org
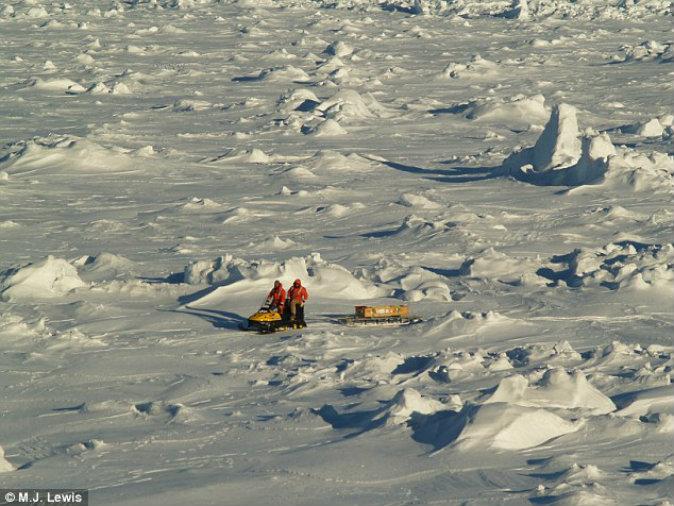
But Antarctica is dealing with the opposite.

A study found that two continual geological elements—the topography of Antarctica and the depth of the ocean surrounding it—are impacting winds and ocean currents, which are pushing the formation and evolution of sea ice cover and helping sustain it.

“Our study provides strong evidence that the behavior of Antarctic sea ice is entirely consistent with the geophysical characteristics found in the southern polar region, which differ sharply from those present in the Arctic,” said Son Nghiem of NASA’s Jet Propulsion Laboratory.

The sea ice in Antarctica is dominated by first-year sea ice. It reaches its greatest extent around the continent in September every year and recedes about 17 percent in February. Since the late 1970’s the sea ice’s expanse has been stable, with just minimal increase.

NASA QuikScat data of Antarctic sea ice movement (June-Sept. 2008) overlaid on maps of sea ice type (white = rough older ice; light blue = older ice, darker blue = younger ice, red = melt on ice, gray = permanent ice, brown = land, deep blue = open water. Red/black dots track ice movement over time.<br/> (Credits: NASA/JPL-Caltech/University of Washington, U.S. National Ice Center)
NASA QuikScat data of Antarctic sea ice movement (June-Sept. 2008) overlaid on maps of sea ice type white = rough older ice; light blue = older ice, darker blue = younger ice, red = melt on ice, gray = permanent ice, brown = land, deep blue = open water. Red/black dots track ice movement over time.
(Credits: NASA/JPL-Caltech/University of Washington, U.S. National Ice Center

But the behavior of ice has been a mystery to scientists.

The recent study analyzes radar data from NASA’s QuikScat satellite from 1999 through 2009 to learn the paths of sea ice in the continent and map its different types. Scientists focused on the 2008 growth season, which had abnormal seasonal variability in Antarctic sea ice coverage.

Researchers found that as sea ice forms and accumulates early in the growth season, it gets forced offshore and to the north by winds. This forms a protective shield of older and thicker ice that circulates Antarctica. The relentless winds that flow downslope off the continent are shaped by Antarctica’s topography, which pile up against the enormous ice shield and make it even thicker.

Map of sea surface temperatures (in degrees Celsius) combined with sea surface temperature contour lines for -1 degree Celsius (black) and -1.4 degrees Celsius (green), plotted atop a National Ice Center map of the extent of Antarctic sea ice on Sept. 22, 2009.<br/>(Courtesy: NASA/JPL-Caltech)
Map of sea surface temperatures (in degrees Celsius) combined with sea surface temperature contour lines for -1 degree Celsius (black) and -1.4 degrees Celsius (green), plotted atop a National Ice Center map of the extent of Antarctic sea ice on Sept. 22, 2009.
Courtesy: NASA/JPL-Caltech

That band of ice varies in width from about 62 to 620 miles. It encases and protects younger and thinner ice from being reduced by winds and waves in the ice pack behind it.

Scientists used QuikScat radar data to distinguish the different types of sea in the continent. Older and thicker ice emit a stronger radar signal than younger and thinner ice.

The data shows sea ice encased in the protective shield was older and rougher because it was exposed to wind and waves. The protected ice was also thicker, due to more ice growth and snow pile up.

“As the sea ice cover expands and ice drifts away from the continent, areas of open water form behind it on the sea surface, creating ‘ice factories’ conducive to rapid sea ice growth,” said the NASA study.

Location of the southern Antarctic Circumpolar Current front (white contour), with -1 degree Celsius sea surface temperature lines (black contours) on Sept. 22 each year from 2002-2009, plotted against a chart of the depth of the Southern Ocean around Antarctica. The white cross is Bouvet Island.<br/>(NASA/JPL-Caltech)
Location of the southern Antarctic Circumpolar Current front (white contour), with -1 degree Celsius sea surface temperature lines (black contours) on Sept. 22 each year from 2002-2009, plotted against a chart of the depth of the Southern Ocean around Antarctica. The white cross is Bouvet Island.
NASA/JPL-Caltech

Scientists also found out how the Southern Ocean maintains this great ice shield.

The shields form at the temperature line of 30-degree Fahrenheit at the Antarctic Circumpolar Current front, which separates the circulation of cold and warm waters around Antarctica. Researchers hypothesized that the location of this front follows the underwater bathymetry.

“When they plotted the bathymetric data against the ocean temperatures, the pieces fit together like a jigsaw puzzle,” said the study.

Scientists say the current stays closely tightened in the Fawn Trough, while on the other side of the continent, the smooth seafloor loses its grip over the current, allowing sea ice extent to decrease and leads to large year-to-year variations.  

The study was published in the journal Remote Sensing of Environment.