Canadian Economy’s Underperformance Pre-Dates COVID and Is ‘Worsening’: Study

Canadian Economy’s Underperformance Pre-Dates COVID and Is ‘Worsening’: Study
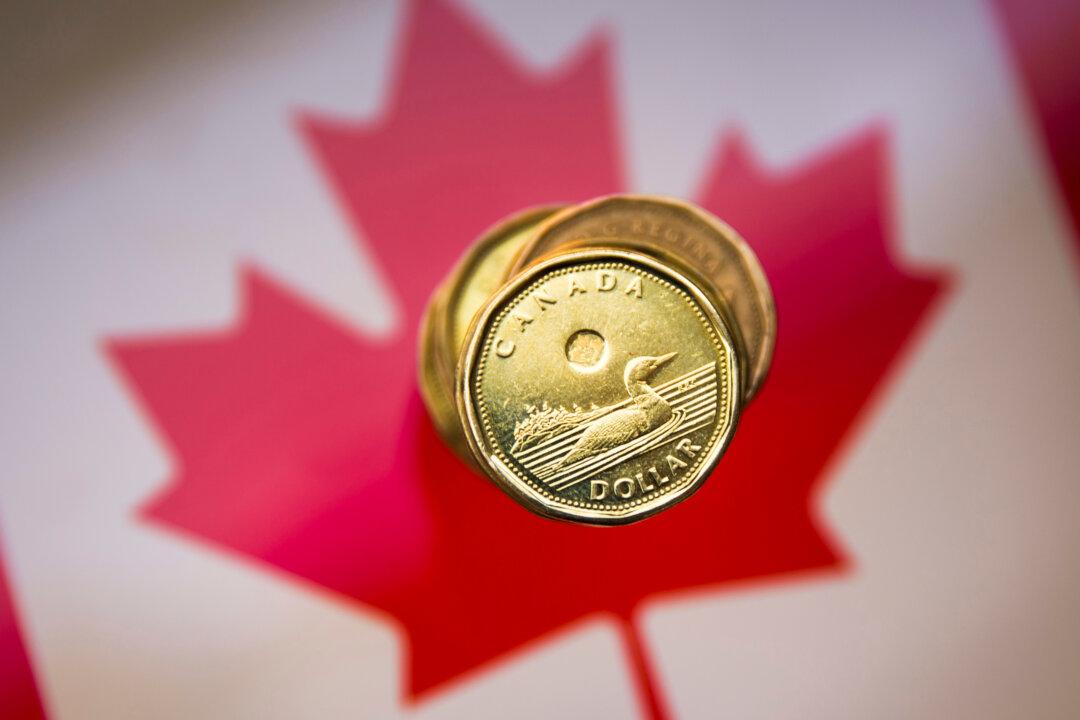
A Canadian dollar coin is pictured in this illustration picture taken in Toronto, Jan. 23, 2015. (Reuters/Mark Blinch)
Noé Chartier
Updated:
0:00

Canada’s economy was being outperformed by many of its peer countries before the COVID-19 crash of 2020, due to lags in key sectors such as business investment, says a public policy think tank.

The Fraser Institute released a study on Aug. 7 comparing Canada to other developed countries in the Organization for Economic Cooperation and Development (OECD).
“It may be tempting for policymakers to blame Canada’s poor economic performance on the COVID pandemic and all the disruptions it caused, but the truth is Canada has been underperforming its international peers in important ways for many years,” said Fraser Institute executive vice president Jason Clemens in a statement.

Clemens says the relative underperformance started over a decade ago and has been “worsening,” whether it’s measured by living standards, investments, or productivity.

The study is not focused on the five most recent years but instead covers the last business cycle of 2007 to 2019. Business cycles are phases in the economy marked by expansions and recessions, with 2007 marking the start of the “Great Recession” in the U.S. with the mortgage crisis.

Canada’s gross domestic product (GDP) grew by 22.5 percent over the period, which puts it in 14th place; the middle of the pack among 32 OECD countries.

The study’s author, economist Francisca Dussaillant, points to limitations in relying solely on GDP figures given the disparity in population size and growth between countries.

Dussaillant notes Canada saw a “significant influx” of newcomers during the period with a growth rate of 14.3 percent. By comparison, the U.S. grew by 9.6 percent and Australia 16.7 percent, while Greece shrank by 3 percent.

When measuring GDP per capita, a common indicator to measure living standards, the study says Canada experienced a relative decline compared to the OECD average.

Canada’s per-person GDP rose 7.2 percent from 2007 to 2019, ranking 19th among 31 OECD countries, for which the average was 11.5 percent. The U.S. saw growth of 12.7 percent over the period and Australia 10.8 percent.

GDP per capita measures for Canada and the U.S. were similar from 2010 to 2013, according to International Monetary Fund data. Afterwards, Canada’s GDP per capita dropped and stagnated. Canada’s GDP per capita stood at US$52,7100 in 2013, while the United States was at US$53,360

As of 2024, Canada made modest gains reaching US$54,870, whereas the U.S. is 56 percent higher at US$85,370.

National Bank economists said earlier this year that Canada’s population has grown too fast for the amount of capital available in the country, calling it a “population trap”—a phenomenon usually found in emerging economies.

“Our population is growing so fast that we do not have enough savings to stabilize our capital-labour ration and achieve an increase in GDP per capita,” they wrote in a report published Jan. 15.

With regards to investment, the Fraser Institute study says Canada was above the OECD average in 2007, as measured by the ratio of total Gross Fixed Capital Formation (GFCF) to GDP. By 2013 it began declining, however, and fell lower than the OECD average in 2016.

Study author Dussaillant writes the 11.1 percent fall in business investment over the period is a “particularly stark indicator of this trend.”

“Its poor investment performance suggests Canada might be facing challenges in keeping its economy vibrant over the long term,” said Dussaillant.

Canada also lagged behind the OECD in terms of productivity, marking an increase of 10.3 percent in GDP per hour worked compared to the OECD average of 11.2 percent.

With regards to labour force participation and employment rate, the study says Canada experienced “relative stability,” while noting the public sector workforce grew faster (17.3 percent) than the private sector (13.3 percent).

The federal public service, overseen by the Treasury Board, had around 283,000 employees in 2010 and reached 367,772 employees this year.