Congress OKs More Spending, Debt as Survey Shows Most Americans Want Less

Congress OKs More Spending, Debt as Survey Shows Most Americans Want Less
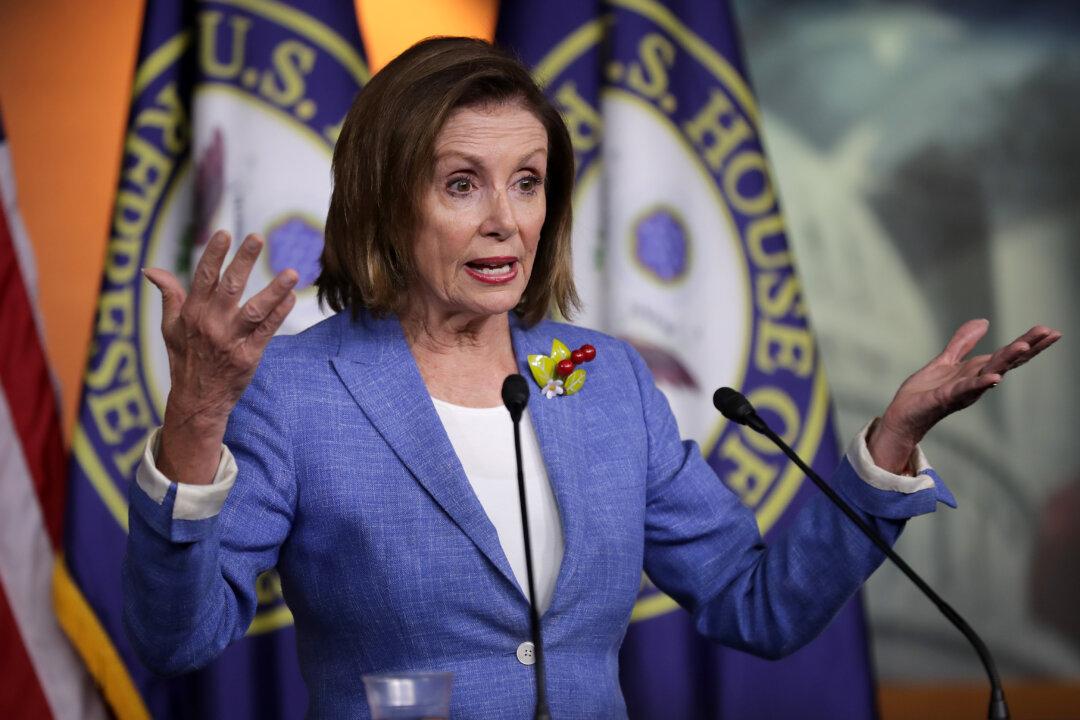
Speaker of the House Nancy Pelosi (D-Calif.) at the U.S. Capitol Visitors Center in Washington on July 26, 2019. Chip Somodevilla/Getty Images
Mark Tapscott
Updated:

WASHINGTON—A day before the Senate added $320 billion to the federal budget and suspended the $22 trillion national debt ceiling, a majority of Americans said they think that’s the wrong way to go.

Fifty-six percent of respondents to a survey done by Scott Rasmussen agreed that “cutting government spending is better for the long-term health of the economy,” compared to only 21 percent who said increased expenditures would be better.
A bigger majority, 59 percent, said the U.S. economy would benefit from “cutting budget deficits,” while 16 percent said bigger deficits would be better.

A plurality of the respondents, 41 percent, agreed that fewer regulations would result in a healthier economy, with 35 percent preferring more government rules.

Rasmussen conducts the Weekly Pulse survey for the Job Creators Network Foundation (JCNF). The survey interviewed 1,074 individuals on July 29–30, and the results have a 3 percentage point margin of error. The JCNF advocates for conservative economic policies on behalf of small business.

The Aug. 1 vote by the Senate on the two-year budget deal followed the July 25 agreement by the House of Representatives. The deal was mainly negotiated by Speaker of the House Nancy Pelosi (D-Calif.) and Secretary of the Treasury Steven Mnuchin.

President Donald Trump backed the agreement, but only half of House Republicans supported it, and almost two dozen Republicans in the Senate opposed it.

Besides increasing federal spending through 2021, the agreement suspends the debt ceiling, which allows the government to continue borrowing funds to cover its deficits, which are soon expected to reach $1 trillion annually.

Trump said he supports the deal because it keeps defense spending at levels he desires, and because it means no more budget fights or potential government shutdowns until after the 2020 election.

But the survey results suggest Trump may have stronger public support for much sterner fiscal measures to rein in government, much as he has slashed federal regulations since taking office in 2017.

Majority support exists for cutting spending across gender and generational lines, with 54 percent of men favoring fewer government outlays, and 57 percent of women doing so.

Similarly, majorities for spending cuts were seen in every age group except those between 35 and 49 years. Support for cuts reached 52 percent among 18–24 year-olds, 57 percent among those between 50 and 64, and zoomed to 67 percent among those 65 and older.

The only segment where less than a majority backed spending cuts was among those 35–49, with 48 percent.

The same pattern was seen when the results were viewed via generations, with 62 percent support for spending cuts among Baby Boomers, 53 percent among Gen Xers, and 52 percent among Gen Zers. Only 49 percent of Millennials supported spending cuts.

Among ethnic groups, whites were strongly supportive of spending cuts at 59 percent, as were Hispanics at 55 percent, but the approach only received support among a plurality, 41 percent, of blacks and Asians.

Geographically, majorities were seen in all four regions of the United States, ranging from 51 percent in the Northeast to 56 percent in the Midwest, 57 percent in the South, and the same percentage in the West.

The survey also asked a number of questions designed to gauge how respondents view their own and the national economy, presently and in coming days.

Rasmussen asked respondents if they believe the U.S. economy is getting better or worse, and found that 37 percent said better, 24 percent said worse, and 33 percent about the same.

Ethnic responses to the question of whether the economy is getting better or worse showed 44 percent of Whites and 34 percent of Asians said better, compared to 19 percent and 26 percent saying worse, respectively.

A much more negative picture was seen among blacks and Hispanics, however, with 20 percent of Blacks and 23 percent of Hispanics saying better, compared to 36 percent and 37 percent, respectively, saying worse.

Among generational responses, older respondents were much more optimistic, with 40 percent of Boomers and 38 percent of Gen Xers saying better, compared to 19 percent and 24 percent saying worse, respectively.

For Gen Zers and Millennials, the percentages were 22 and 35 saying better, versus 30 and 32 saying worse.

Asked how their personal finances are today, 52 percent of those polled answered either excellent or good, compared to 46 percent who said fair or poor.

Among men, 57 percent said their personal finances were good or excellent, but only 48 percent of the women said good or excellent.

Asked if their personal finances are getting better or worse, 35 percent of those polled said better, versus 17 percent who said worse, with 44 percent saying about the same.

Asked if they expect private companies in their area to be more likely to be adding workers or laying them off in the near future, 46 percent expect expanding workforces, compared to 19 percent who expect reductions.

Mark Tapscott
Mark Tapscott
Senior Congressional Correspondent
Mark Tapscott is an award-winning senior Congressional correspondent for The Epoch Times. He covers Congress, national politics, and policy. Mr. Tapscott previously worked for Washington Times, Washington Examiner, Montgomery Journal, and Daily Caller News Foundation.
twitter
Related Topics