S&P 500 Falls Back Into Bear Market as Wall Street Opens Down

S&P 500 Falls Back Into Bear Market as Wall Street Opens Down
Traders work at the New York Stock Exchange (NYSE) at Wall Street in New York on Feb. 24, 2020. Johannes Eisele/AFP via Getty Images
Tom Ozimek
Updated:
0:00

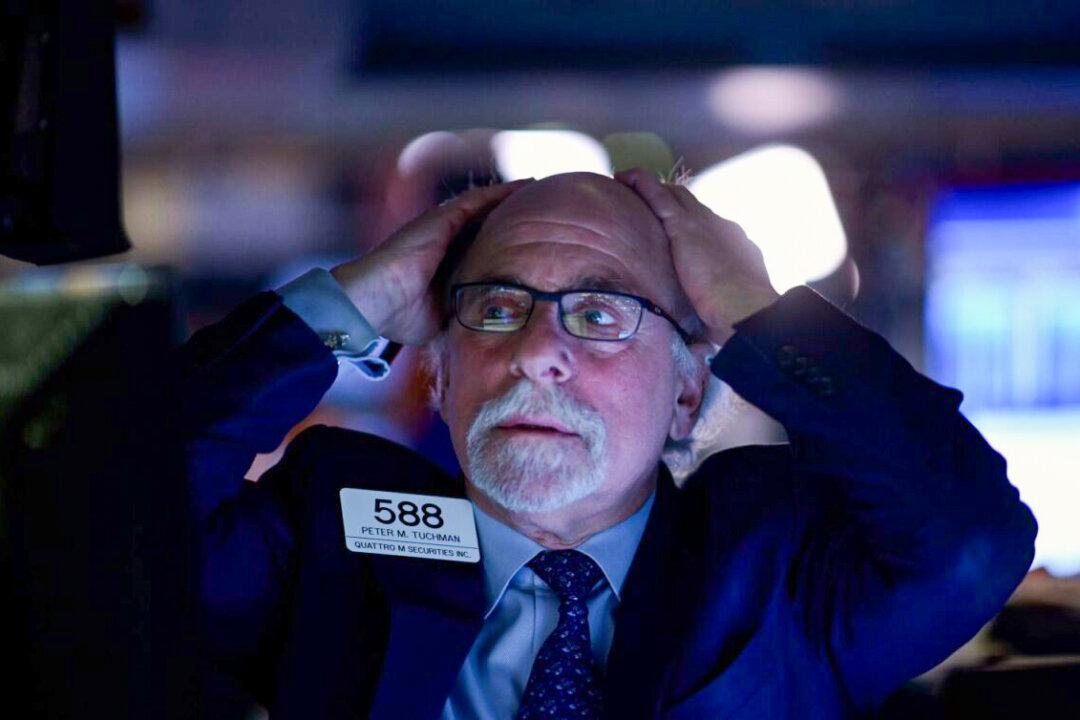
Wall Street’s main indexes opened sharply lower on Monday amid a broader risk-off sentiment that also saw cryptocurrencies take a beating, while the benchmark S&P 500 fell into a bear market intraday as a higher-than-expected inflation print last week raised bets the Fed would tighten faster and further to quell price pressures.

Shortly after opening bell at 9:37 a.m. on June 13, the Dow Jones Industrial Average fell 563.56 points, or 1.80 percent, to 30,829.23; the Nasdaq Composite lost 284.93 points, or 2.51 percent, to 11,055.10; while the S&P 500 shed 87.03 points, or 2.23 percent, to 3,813.83.
The S&P 500, which serves as a broader barometer of U.S. equities, now sits more than 20 percent off its record close in January, which is technically bear market territory. The index traded below the 20-percent threshold briefly intraday nearly a month ago before narrowly dodging closing below the psychological barrier. A lower close on Monday would confirm the S&P 500 is in a bear market.

Nick Reece, VP of macro research and investment strategy at Merk Investments, told The Epoch Times in a recent emailed statement that “the 20 percent decline threshold for defining a bear market is a somewhat arbitrary cutoff point” and, as such, its significance is more psychological than material. Still, he said he believes it’s likely that the current S&P 500 drawdown will exceed 20 percent peak to trough and so will “technically” confirm a bear market but will not match the depth of the 2007–2008 financial crisis.

“Though it’s no guarantee of the outcome, I continue to view the most recent all-time high (on Jan 3rd) as historically inconsistent with past major market tops and therefore unlikely to produce a major bear market like that of the early 2000s or 2007–2009 (on the S&P 500),” he said.

Meanwhile, a recessionary red flag was raised on Monday when the yield curve inverted on the bellwether 2-year/10-year U.S. Treasury spread on expectations that the Federal Reserve might tighten monetary policy settings more abruptly and quickly in an effort to tame soaring inflation.

The U.S. 2-year Treasury yields climbed above 10-year borrowing costs on June 13 for the first time since a brief inversion in April, with the gap falling to as low as minus 0.02 percentage points, Tradeweb prices showed.

The closely-watched spread between the 2-year and 10-year Treasury yield is viewed by many analysts as one of the most reliable recession red flags.

The U.S. economy contracted by 1.5 percent in the first quarter, with a recession generally defined as two consecutive quarters of negative economic growth.

The latest Atlanta Fed Bank GDPNow forecast estimates that America’s gross domestic product will grow 0.9 percent in the second quarter.
Tom Ozimek
Tom Ozimek
Reporter
Tom Ozimek is a senior reporter for The Epoch Times. He has a broad background in journalism, deposit insurance, marketing and communications, and adult education.
twitter
Related Topics