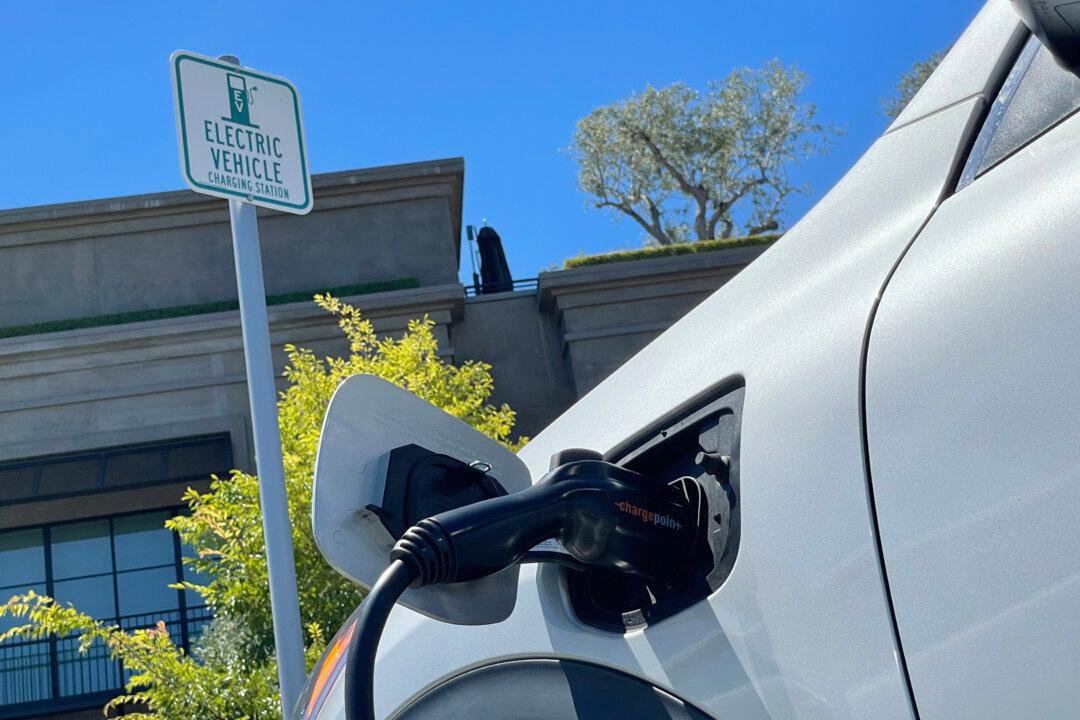
For years I’ve been writing columns saying California’s electric grid couldn’t handle all the electric cars soon to come online. Now it’s obvious because it’s happening in real time.
“With excessive heat in the forecast across much of the state and Western U.S., the grid operator is expecting high electricity demand, primarily from air conditioning use, and is calling for voluntary conservation steps to help balance supply and demand. Additional Flex Alerts are also possible through the Labor Day weekend as record setting temperatures are forecast across much of the West.”
The alert recommended avoiding activities such as charging electric vehicles between 4 p.m. and 9 p.m., “when the grid is most stressed from higher demand and less solar energy.”
This was explained nine years ago in an article by Wayne Lusvardi on a now defunct news site, CalWatchDog.com, where I was managing editor. Yes, this has been known for a long time.
Here’s an updated version of the chart from the ISO, issued in 2016, which does indeed look like a duck.
Oversupply is when all anticipated generation, including renewables, exceeds the real-time demand. The potential for this increases as more renewable energy is added to the grid but demand for electricity does not increase. This is a concern because if the market cannot automatically manage oversupply it can lead to overgeneration, which requires manual intervention of the market to maintain reliability. During oversupply times, wholesale prices can be very low and even go negative in which generators have to pay utilities to take the energy. But the market often remedies the oversupply situation and automatically works to restore the balance between supply and demand. In almost all cases, oversupply is a manageable condition but it is not a sustainable condition over time – and this drives the need for proactive policies and actions to avoid the situation. The duck curve in Figure 2 shows that oversupply is expected to occur during the middle of the day as well.A similar graph from 2020 also shows the problem. It’s from the U.S. Energy Information Administration and is featured in a Wikipedia entry on the duck curve. Note the graph on the right, for July and August, which shows the problem around 5 to 6 p.m., as solar power declines and wind power has yet to ramp up sufficiently. Aug. 31 is just three weeks before the beginning of autumn, and the sun is setting much earlier.
The entry notes, “Because these graphs do not display energy demand, they are not duck curves themselves, but demonstrate daily and seasonal variation in power production.”