These actions helped American households and businesses weather the pandemic in better financial shape than many would have predicted when COVID-19 lockdowns began last March. While millions remain out of work and many businesses have shuttered or remain on the brink, some sectors of the economy easily adapted to COVID-19 and many households—especially higher earners—saw their wealth grow from increased savings, robust government stimulus, and strong stock market returns. And as life in the United States returns to normal, pent-up demand has lifted hard-hit sectors like transportation, retail, tourism, and hospitality this summer.
However, certain investors, economists, and other experts have begun to express fears that the unusual conditions of the COVID-19 economy and large amounts of government stimulus are bringing on a new economic challenge: inflation. These observers worry that the amount of money in the economy and quickly recovering demand in many sectors will continue pushing prices higher throughout this year.
These trends have provoked different responses from economic observers. Some individual and institutional investors are looking to hedge against rising inflation rates by rushing to invest in gold, cryptocurrency, and other investments, which they believe will hold their value better than the dollar and outperform the market during periods of inflation. Others argue that current price trends are “transitory” and merely reflective of the ongoing effects of supply chain breakdowns during the pandemic and shifts in consumer demand as more activities like travel become safer again.
Those in the latter camp can point to the difference in increases across CPI categories as evidence that inflation may be more of a temporary correction than a long-term threat. Food and beverages (up 2.4 percent year-over-year) and housing (up 3.1 percent) are close to the Fed’s usual target inflation figure of 2 percent. However, transportation has seen a 21.5 percent increase, largely from increases in the price of new and used cars, which are more scarce because of supply chain breakdowns and part shortages. Additionally, compared to last year’s record low prices, the cost of airline tickets is up with more people traveling. Similarly, energy showed a 24.5 percent increase year-over-year, following sharp declines in oil and gas prices during lockdowns.
Large Metros With the Highest Rates of Inflation
15. Houston-The Woodlands-Sugar Land, Texas
- All items: +4.6 percent
- Food and beverage: +2.3 percent
- Housing: +2.8 percent
- Apparel: -5.5 percent
- Transportation: +18.4 percent
- Energy: +29.7 percent
14. Minneapolis-St. Paul-Bloomington, MN-WI
- All items: +4.6 percent
- Food and beverage: +1.9 percent
- Housing: +1.4 percent
- Apparel: +9.9 percent
- Transportation: +21.0 percent
- Energy: +24.4 percent
13. Chicago-Naperville-Elgin, IL-IN-WI
- All items: +4.7 percent
- Food and beverage: +4.8 percent
- Housing: +3.7 percent
- Apparel: +4.0 percent
- Transportation: +17.0 percent
- Energy: +28.7 percent
12. Philadelphia-Camden-Wilmington, PA-NJ-DE-MD
- All items: +4.9 percent
- Food and beverage: +0.9 percent
- Housing: +2.7 percent
- Apparel: +6.9 percent
- Transportation: +18.9 percent
- Energy: +19.8 percent
11. Miami-Fort Lauderdale-West Palm Beach, FL
- All items: +5.1 percent
- Food and beverage: +0.8 percent
- Housing: +3.6 percent
- Apparel: +8.4 percent
- Transportation: +20.1 percent
- Energy: +26.7 percent
10. San Diego-Carlsbad, CA
- All items: +5.3 percent
- Food and beverage: +2.2 percent
- Housing: +2.6 percent
- Apparel: +7.5 percent
- Transportation: +22.0 percent
- Energy: +31.3 percent
9. Phoenix-Mesa-Scottsdale, AZ
- All items: +5.4 percent
- Food and beverage: +2.4 percent
- Housing: +4.2 percent
- Apparel: +11.1 percent
- Transportation: +16.9 percent
- Energy: +20.7 percent
8. Detroit-Warren-Dearborn, MI
- All items: +5.4 percent
- Food and beverage: +5.3 percent
- Housing: +5.0 percent
- Apparel: -3.2 percent
- Transportation: +12.0 percent
- Energy: +24.9 percent
7. Seattle-Tacoma-Bellevue, WA
- All items: +5.5 percent
- Food and beverage: +5.6 percent
- Housing: +1.9 percent
- Apparel: +8.3 percent
- Transportation: +21.7 percent
- Energy: +25.1 percent
6. Riverside-San Bernardino-Ontario, CA
- All items: +5.9 percent
- Food and beverage: +2.5 percent
- Housing: +3.3 percent
- Apparel: +5.2 percent
- Transportation: +22.8 percent
- Energy: +28.0 percent
5. St. Louis, MO-IL
- All items: +6.1 percent
- Food and beverage: +3.5 percent
- Housing: +4.4 percent
- Apparel: +7.0 percent
- Transportation: +20.7 percent
- Energy: +24.1 percent
4. Tampa-St. Petersburg-Clearwater, FL
- All items: +6.2 percent
- Food and beverage: +1.9 percent
- Housing: +5.5 percent
- Apparel: +5.5 percent
- Transportation: +17.9 percent
- Energy: +25.3 percent
3. Urban Alaska
- All items: +6.2 percent
- Food and beverage: +2.5 percent
- Housing: +2.8 percent
- Apparel: +5.7 percent
- Transportation: +26.8 percent
- Energy: +18.3 percent
2. Dallas-Fort Worth-Arlington, TX
- All items: +6.3 percent
- Food and beverage: +2.8 percent
- Housing: +2.8 percent
- Apparel: +7.8 percent
- Transportation: +28.2 percent
- Energy: +25.3 percent
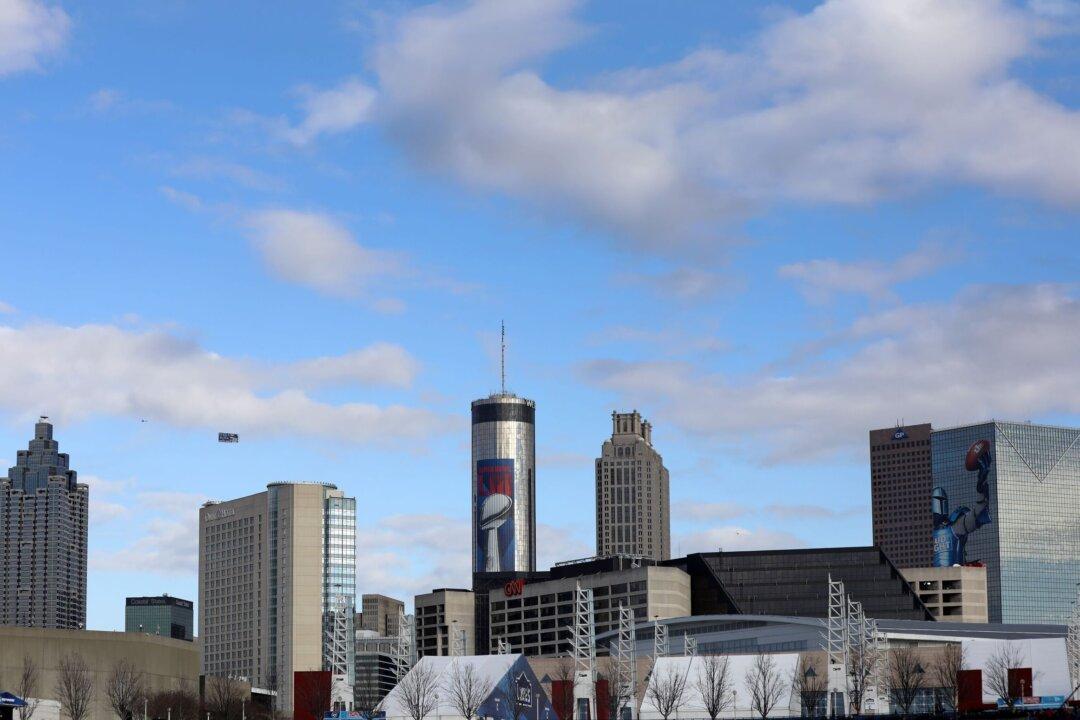
1. Atlanta-Sandy Springs-Roswell, GA
- All items: +6.7 percent
- Food and beverage: +1.7 percent
- Housing: +4.1 percent
- Apparel: +11.2 percent
- Transportation: +23.9 percent
- Energy: +27.5 percent