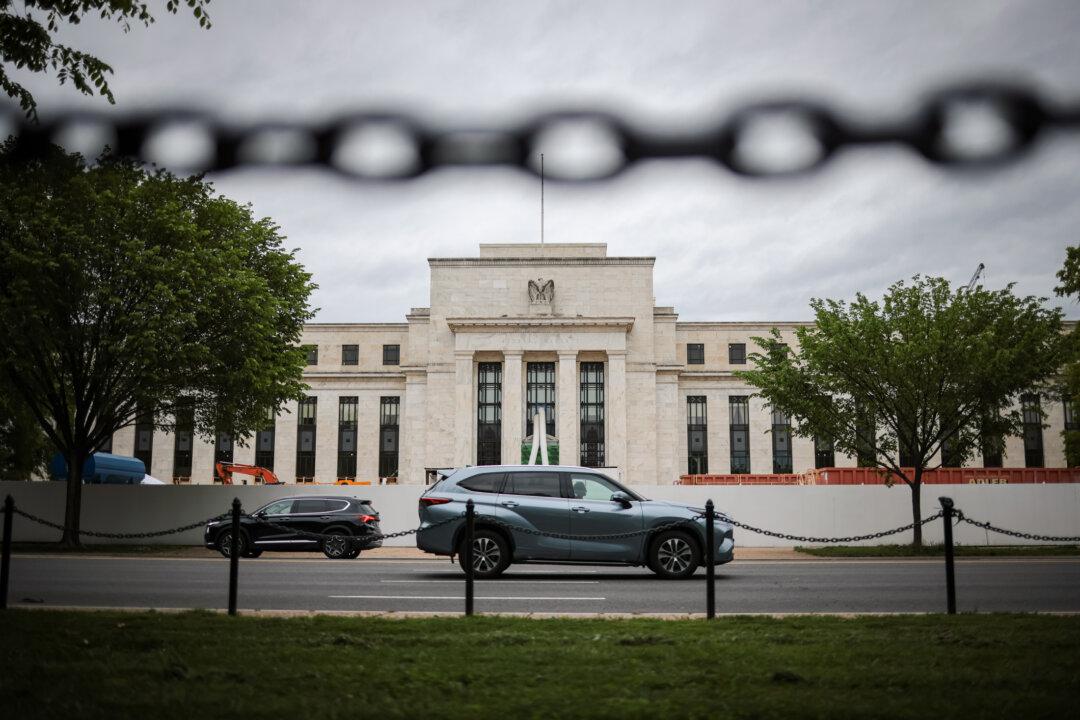
Disinflation in China is one of the eye-catching macroeconomic phenomena against the backdrop of global high inflation. Look at the other BRICS countries: India’s latest inflation stands at 7 percent, South Africa at 8 percent, Brazil at 9 percent, and Russia at 14 percent. China? Below 3 percent. Real estate and debt deleveraging (reducing debt) must be accountable for the disinflation. This is what Japan experienced from the 1990s to last year. Even Japan is now seeing 3 percent inflation which is higher than that of China. From now on, we have to introduce a new label “Asia ex-China” to replace “Asia ex-Japan.”
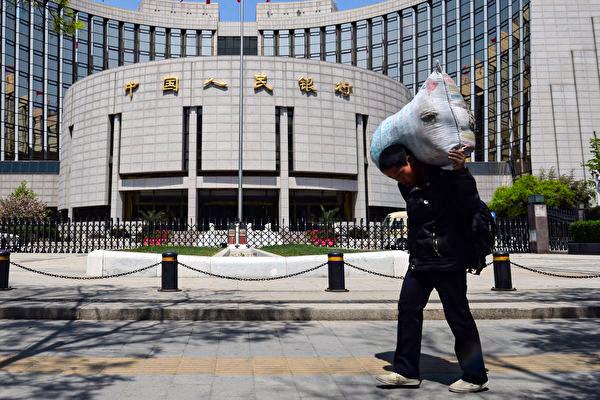
Inflation (the rate of increase in prices) is the outcome of excess money. If the created money is absorbed by real activities, financial products, or other assets, then there would not be excess to generate inflation. Yet China is undergoing economic recession (decline in economic activity) and assets deleveraging (reduction of debt), money has actually been outflowing from these markets instead of the other way round. Presumably speaking, there should be excess liquidity (available cash) given the government has been boosting for years. Look at the money supply data: M0 (physical currency) year-over-year (YoY) growth is trending up to 14 percent, and that of M2 to 12 percent.
However, money will generate inflation only if it “flows.” A stock of piled money will not have any economic impact. The flow of money is best measured by credit. Look at the Yuan loans YoY growth: It has been falling from the peak of 34 percent at the end of 2019 to below 11 percent in August, a level back to 2002, not seen for two decades. This is exactly the phenomenon seen in the U.S. from 2008 to 2015, where three rounds of quantitative easing (increase in the money supply) with huge money injected did not generate any meaningful inflationary pressure—inflation remained below 2 percent.
In principle, broad money growth (M2) should imply the direction of inflation with a 1.5 to 2 years lag. The accompanying chart shows the case of China, where M2 and CPI YoY growth rates are plotted together with 1.5 years’ lag (compare the scales of the two vertical axes). From 2002 to 2015, the relationship between the two (with a lag) was good. It was since 2015 when China’s real estate market began to collapse where the Western economies recovered, that inflation was not implied by money growth. A similar phenomenon was seen prior to 2002.
Credit governs the money velocity, but it is unclear how to make it flow better without having a bright economic outlook. An interest rate cut is a solution by lowering the price of credit, but a few basis points cheaper would not help at all. Also, the expected loss from borrowing could be larger than the lowered cost, rendering the reluctance to borrow and invest. This suggests only when the economic outlook is fundamentally improved will credit soar. And outlook would only be improved if asset prices are no longer overvalued (fully deleveraged).
A sluggish price adjustment means the deleveraging process is bound to be very slow. This also means a prolonged disinflation or even deflation era that will span over a decade—the pursuit of political stability at all costs.