China’s Producer Price Index Hits 13-Year High

China’s Producer Price Index Hits 13-Year High
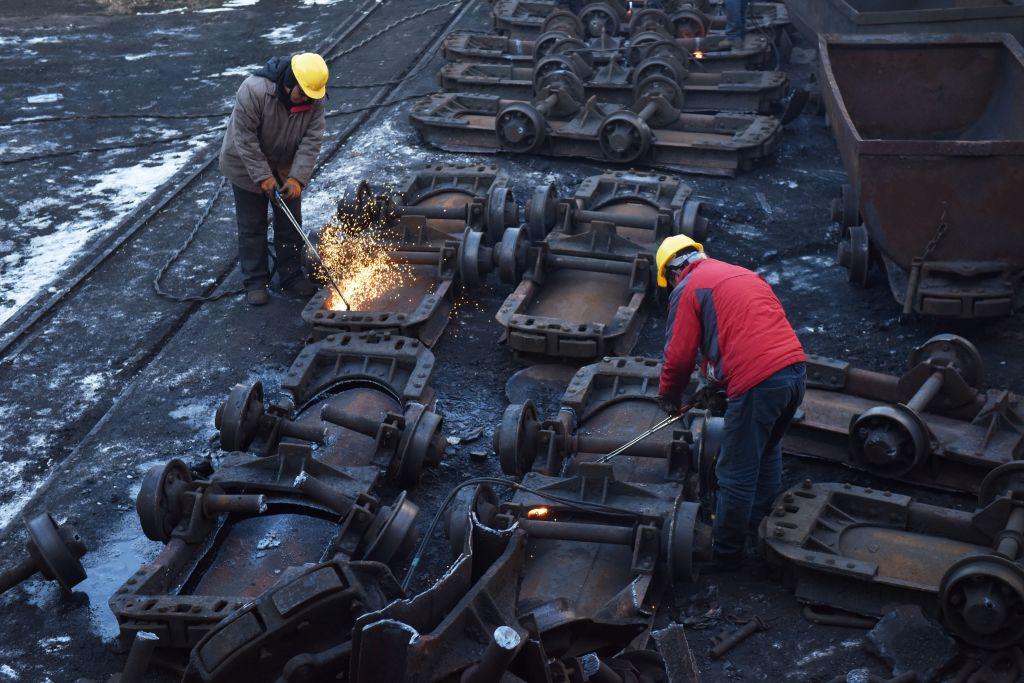
Workers cut up coal carts at the Datai coal mine in Mentougou, west of Beijing, on Dec. 18, 2019. Greg BakerAFP via Getty Images
Updated:
China’s Producer Price Index (PPI) year-on-year increase in May hit its highest in nearly 13 years, according to data released by the Chinese Communist Party (CCP). Officials blamed monetary easing policies in Europe and the United States in response to the global CCP virus pandemic, which broke out in Wuhan, China, in late 2019.

PPI reflects the change, trend, and range of the ex-factory price of industrial enterprise products when sold for the first time, and is one of the important indicators reflecting inflation.
China’s PPI in May was 9 percent higher than in May 2020, the largest year-on-year increase since September 2008, according to a report by the National Bureau of Statistics (NBS) on June 9.

According to the report, prices of food, clothing, and other essential livelihood products rose only 0.5 percent year on year—a small impact on PPI growth. However, prices of means of production increased by 12 percent year on year, affecting the overall PPI increase by 8.87 percentage points. Among them, the price of products in extractive industries increased by 36.4 percent.

The NBS table also shows that between January and May, the biggest year-on-year increases in producer prices among major industries were for ferrous metals (iron, manganese, and chromium) mining, and smelting, up 34.5 percent and 22.5 percent, respectively.

Dong Lijuan, a senior statistician at the NBS’s urban department, also pointed to products with large price increases when interpreting the May 2021 PPI data. Prices for oil, coal, and other fuel processing industries rose 4.4 percent month-on-month in May from April’s drop, she said. Influenced by thermal power plants’ “peak summer and increase of reserves,” thermal coal demand is relatively strong, driving the price of coalmining and dressing industry up 10.6 percent month-on-month. Ferrous metal smelting and rolling processing industry prices rose by 6.4 percent month on month, affected by rising costs of raw materials such as iron ore and coke, an important industrial fuel used mainly in iron ore smelting.

All of these data suggest that China’s industrial price index rise in May was mainly driven by higher prices for commodities such as iron ore, coal, and oil.

Angered by the ban on Chinese company Huawei’s involvement in Australia’s 5G infrastructure and demands for an investigation into the source of the CCP virus outbreak, the regime last year launched a trade war against Australia, restricting imports of iron ore and coal from the country. However, due to the high quality of Australian ore, purchasing ore from other countries has a great impact on procurement costs.

Take coal as an example. Last December, when the CCP violated an agreement with Australian coal mines to restrict the import of Australian coal, Australian Trade Minister Simon Birmingham said that the energy production efficiency of Australian coal mines was 1.5 times higher than that of China and other countries, which meant that if China wanted to maintain the same amount of energy production, it needed to purchase more coal from somewhere else.

Meanwhile, Brazil’s capacity has been affected by the global pandemic in the last six months. As the pandemic subsides, many governments have introduced monetary easing policies to stimulate the economy, which has led to the rise in commodity prices.

Guo Shuqing, chairman of the China Banking Regulatory Commission, blamed the United States and Europe for monetary easing in response to the pandemic, ignoring the fact that the pandemic was caused by the CCP’s covering up the outbreak in Wuhan and allowing infected individuals to spread it uninhibited.

The IMF estimated in October last year that the global economy would shrink 4.4 percent for 2020—the worst annual plunge since the Great Depression of the 1930s. By comparison, the international economy contracted by a far smaller 0.1 percent after the devastating 2008 financial crisis.

In addition, government-forced closures of businesses during the pandemic led to an unprecedented unemployment tide.

In 2020, 8.8 percent of global working hours were lost relative to the fourth quarter of 2019, equivalent to 255 million full-time jobs. Working-hour losses were particularly high in Latin America and the Caribbean, Southern Europe, and Southern Asia. Working-hour losses in 2020 were approximately four times greater than during the global financial crisis in 2009.