Commentary
Last year, the stock market was down big. The exchange-traded fund that mimics the tech stocks on Nasdaq (QQQ) was down 19.8 percent. The bond market also took a dive since the Federal Reserve moved aggressively to raise interest rates.
For what it is worth, statistically there is only a 9 percent chance of the market being lower again this year. Of course, based on conditional probability theory, if it is down this year ,it is likely to be down more than last year.
If you didn’t sell any stocks or ETFs last year, did you lose money or not? If you owned a bond that paid 4 percent interest before the Fed began raising interest rates and you didn’t sell, did you lose money or not?
A lot of people operate under the assumption that since they didn’t sell, they didn’t lose. They also operate under the assumption that since their “safe” bond is paying them 4 percent, they aren’t losing money. That’s poor logic and incorrect.
It has to do with using accounting based logic and economic logic to make a decision.
Economic profit is: economic profit = total revenue - (total explicit costs + total implicit costs)
Accounting profit is: accounting profit = total revenue - total explicit costs
There is confusion between tax accounting with economic market-based accounting. Confusing the two really messes up your decision making. Just because the Internal Revenue Service says you didn’t take a loss because you didn’t sell and can’t write the loss off against income doesn’t mean you actually didn’t lose.
We see it in political debates all the time. When advantageous, politicians fudge the numbers using accounting versus real economics. For example, a “fair tax” might seem onerous if you only look at accounting numbers to analyze it. As soon as opportunity costs and economic numbers are included in the calculation, the fair tax is a far better system than the one we currently have.
With the stock ETF, it’s pretty easy to see how much you lost. The price is lower. If you sold, your purchasing power is significantly less than it would have been. You might not have “taken” a loss, but that doesn’t mean you haven’t lost money. You have to total in the opportunity costs of holding that investment.
Bonds are slightly different since their prices aren’t as transparent, and everyone is fooled by the interest rate payment they continue to receive. They feel like they are insulated. However, they aren’t.
When the Federal Reserve decides to raise interest rates, the underlying price of the bond you hold goes down. If you were to try and sell that bond just like the ETF, you’d get less for it. Given the same risk parameters of buying and holding the bond at the old interest rate, the bond issuer would have had to issue it at a higher rate than what they currently are paying. Hence, you are losing out on the opportunity costs of higher rates.
Here is the math.
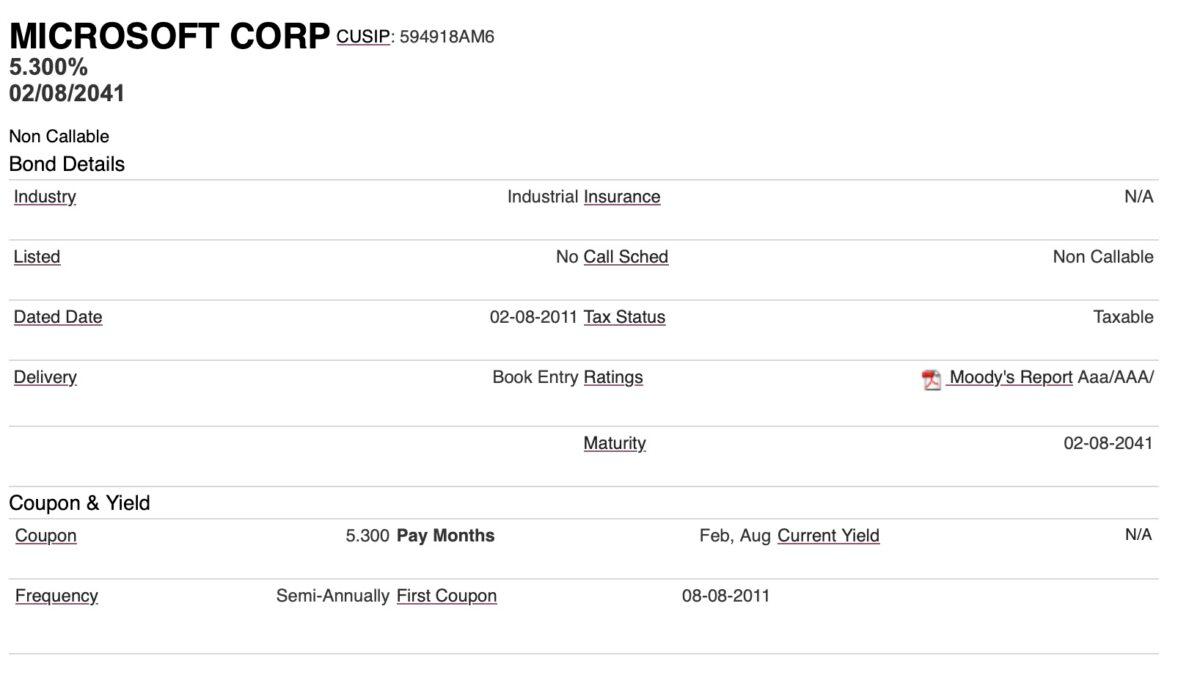
Look at this bond issued by Microsoft. It matures in February 2041 and was originally issued in 2011. It has an interest rate of 5.3 percent that pays twice a year. For comparison, 30-year U.S. Treasury bonds were issued at an interest rate of 3.1 percent at the same time the Microsoft bond was issued. The difference between 5.3 percent and 3.1 percent is the perceived difference in risk between a large public company bond issue and the U.S. federal government bond issue. The bond is also not “callable” so the company can’t tell the bondholders they want refund it. Microsoft is on the hook for interest until 2041. For bondholders, this is a feature because they can build a portfolio with certainty.
The CUSIP number is a unique number given to every bond that is issued. It’s a way to help everyone find it. (CUSIP stands for the Committee on Uniform Securities Identification Procedures; it also is a unique nine-digit identification number assigned to all stocks and registered bonds in the United States and Canada.)
I pulled this data from TD Ameritrade’s website.

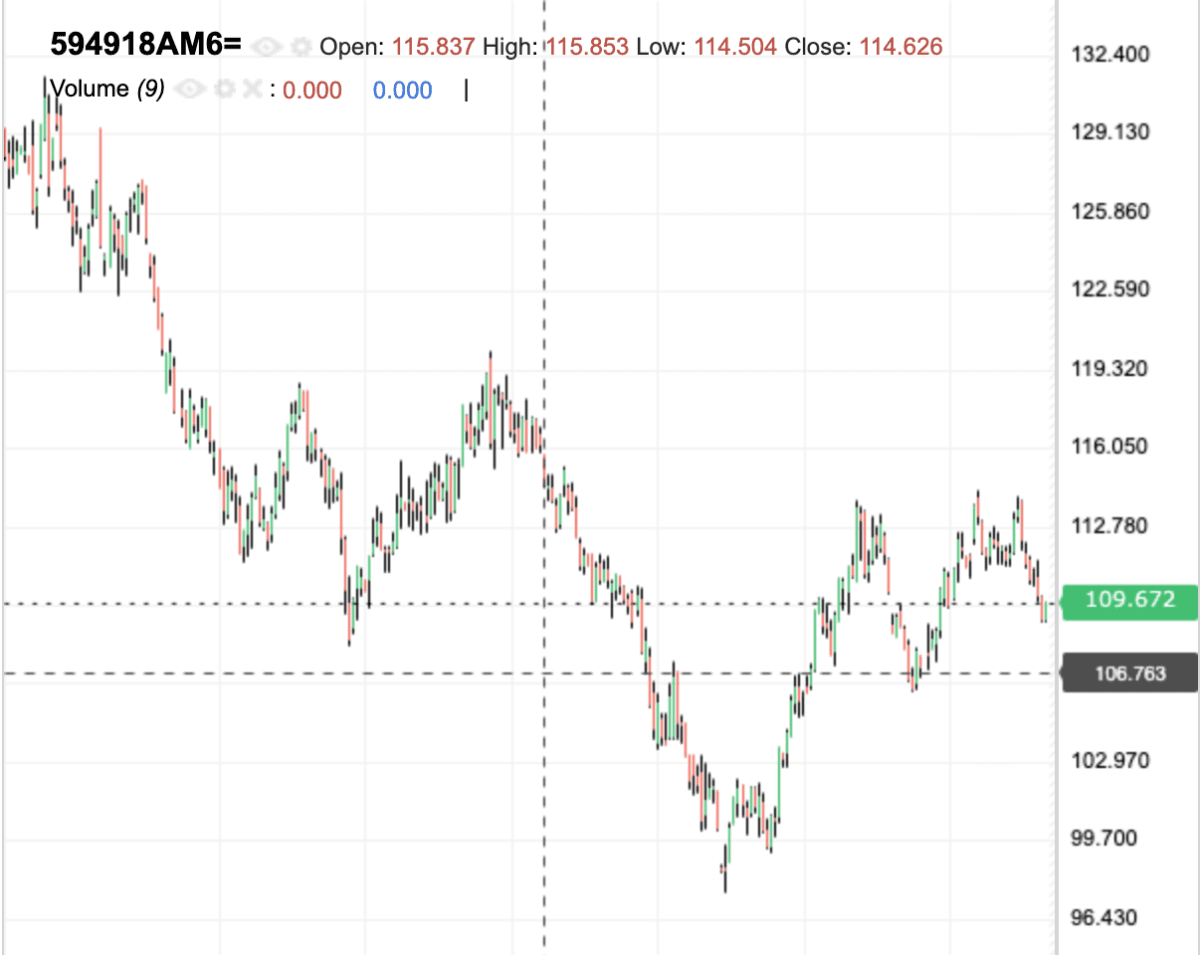
Here is a point and figure chart of how the price of the bond has changed in roughly the last year. The price the market is willing to pay for the bond is lower than it was before. That’s because the Fed raised interest rates, affecting the total return of the bond. This chart is telling you that there are better places to put your money, and the drop in value is not only the market but the opportunity costs of not investing in an alternative.

The answer to the question of “Did you lose money or not?” is—you definitely did! You lost quite a bit, roughly 14.3 percent. You might not feel it because you didn’t sell, but you are losing money just the same. For a slightly different perspective, you can read Cliff Asness post from 2019 when he showed why U.S. Treasury bonds were expensive. If you bought them back then ahead of the Fed tightening, you lost a lot of money even though you continued to collect interest.
When you first purchase a bond, the price is what you pay. That price reflects the risk of holding the bond and the interest rate attached to it. The market sets the price.
Value is what you get. Once the price has dropped, you should analyze if the value you are receiving has also been reduced. When you initially made the purchase decision, you probably thought the value was higher or even with the price. It’s time to do the analysis again using all new information and using economic numbers, not accounting numbers to project the future.


