It is the middle of summer, and the weather has been unavoidably hot across the globe and the free world. Here in Atlanta, where I am based, the summer heat is impossible to escape. Apart from certain mountain communities in the southern Appalachians, Atlanta is completely surrounded by similar geography and heat indexes. It is always hot in the summer in the Southeast, let alone in parts of the Midwest and East Coast. The only differentiator is whether or not the humidity is manageable or if it is completely off the charts.
Regardless, this particular heat wave is scheduled to last through the weekend and next week, as the National Weather Service warned Wednesday: “Across the southern tier of the U.S., monsoon showers and thunderstorms will develop each day in the Southwest, with heavy downpours potentially leading to areas of flash flooding. The WPC [Weather Prediction Center] has issued a Marginal Risk (Threat level 1/4) of Excessive Rainfall for parts of eastern Arizona, southern Colorado, and most of New Mexico. A stronger push of tropical moisture arrives this weekend, prompting the issuance of a Slight Risk (Threat level 2/4) of Excessive Rainfall in southeast Arizona both Saturday and Sunday, while a Slight Risk was also issued for parts of the Colorado Rockies for Sunday. In the Deep South, a Marginal Risk of Excessive Rainfall is in place today, from the ArkLaTex [Arkansas, Louisiana, Texas region] on east to the Carolina coast and Virginia Tidewater. Torrential rainfall within slow moving thunderstorms may lead to flash flooding Friday afternoon and evening.”
In 2016, the ever stable and ready Farmer’s Almanac discussed the 1936 heat wave, describing the state of New York City and its suffering residents: “Central Park in New York City hit 106°F on July 9. The next day, Waterbury, Connecticut, saw 103°F, while many other New England towns hit over 100°F. Those who could left the steaming asphalt of the cities. Others stood under sprinklers or slept on roofs. In New York City, Mayor Fiorello LaGuardia declared public beaches open all night for the duration, promising not to arrest anyone. City swimming pools lengthened their hours. Nearly 1,000 deaths nationwide—76 in New York City—were attributed to the 10-day heat wave, some from heat stroke or lung ailments, others from accidental drownings as nonswimmers desperately attempted to cool off.”
The Economics of Heat Waves
I have included a chart showing the most economically damaging heat waves in recent decades, as well as a downward sloping trendline, which oddly enough shows a decreasing economic cost in regards to heat waves.According to the AARP (formerly the American Association of Retired Persons), the heat wave in 1988 was especially disastrous, stating: “From June through August 1988, heat and drought across a large portion of the U.S. caused severe losses to agriculture and related industries. Eleven states declared disasters, and water levels in the three largest rivers within the continental U.S. were 45 percent below normal in June. An estimated 5,000 people perished from direct and indirect effects of the heat.”
Regarding subsequent heat waves, the AARP continued: “The 2012 drought is considered the worst that has affected the U.S. since the 1930s. Extreme conditions affected more than half the country for most of the year, resulting in widespread loss of corn, sorghum, and soybeans, among other crops. The associated summer heat wave was directly tied to 123 deaths, but the estimated number of deaths due to heat stress is still unknown. In 2020, the temperature hit an astounding 130 degrees Fahrenheit in Death Valley as widespread drought and record heat affected more than a dozen western and central states for much of the summer and continued into the fall. Crops and livestock suffered, and 45 died.”
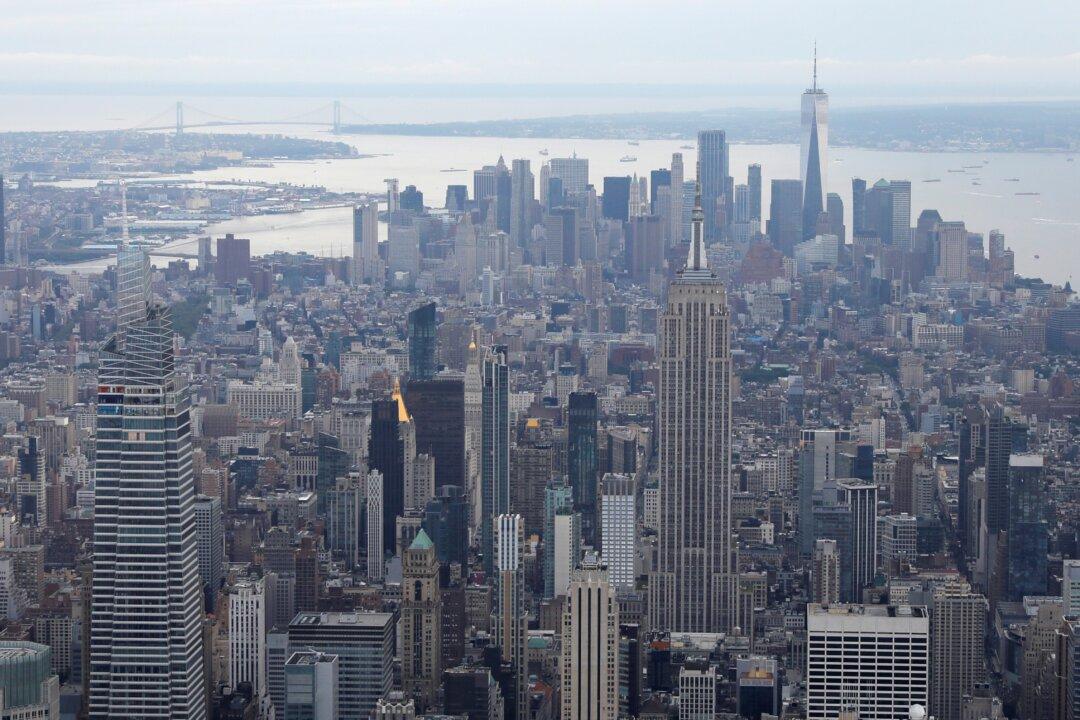
Heat waves are undeniably dangerous, but cities are hotter than the countryside, especially major, built-up areas covered in concrete.
As NASA reported in June this year, cities are usually markedly warmer than the surrounding countryside due to human activities and the materials used in the built environment. The image clearly delineates these urban “heat islands.” Nighttime temperatures in Delhi, India, for example, and several smaller villages in the vicinity were above 95 degrees Fahrenheit (35 degrees Celsius), peaking at about 102 degrees F (39 degrees C), while the rural fields nearby had cooled to around 60 degrees F (15 degrees C). These data suggest that city dwellers are experiencing considerably higher temperatures than the average temperatures reported for their regions.”
In other words, if you are in a heat wave, the worst place to be is in a city surrounded by glass, steel, concrete, and asphalt.