When the Yellowstone volcano erupts again, then the effects would impact cities as far away as New York, Los Angeles, and Miami, according to a new study.
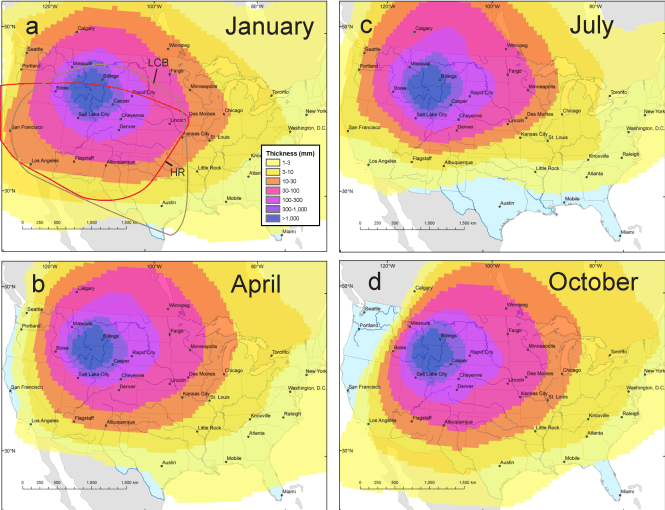
U.S. Geological Survey researchers used an improved computer model to project the potential distribution of ash, publishing different maps that show how winds differ each season as well as taking into account the difference in ashfall depending on the amount of time an eruption lasts.
The study, published in Geochemistry, Geophysics, and Geosystems, includes illustrations of month-long, week-long, and 3-day eruptions across all the seasons.
Although many scientists believe that an eruption at the caldera will not happen anytime soon, three massive eruptions have happened at the caldera over the past 2.1 million years, with the last coming about 650,000 years ago.
The new predictions indicate that a number of cities would receive ash. New York City receives on average in the models 2.5mm of ash (almost an inch), while Los Angeles gets 5.2. Washington, D.C. gets 2.9mm, while Toronto gets 3.7.
Cities that are closer to Yellowstone would get tons of ash. Billings would receive about 1,429mm (56 inches); Casper would get 516.9mm (about 20 inches); Salt Lake City would get 247.9mm (9.7 inches); and Rapid City would get 208.3mm (8.2 inches).
The report authors note that cities west of Yellowstone receive much less ash overall than cities farther east in the models.
“It’s a crazy thing to think about because none of us have ever seen an eruption like Yellowstone,” Larry Mastin, the lead author of the study and a USGS hydrologist who helped develop the Ash3D model, told the Billings Gazette.
“It would be two or three orders of magnitude more ash than we’ve been able to observe.”

Simulated ash thickness and distribution resulting from a projected month-long Yellowstone eruption using wind fields for different seasons. The bold red line delineates the extent of the Huckleberry Ridge Tuff Bed, a prior eruption; the brown line delineates the extent of Lava Creek B Tuff, another prior eruption. (USGS)

Simulated ash thickness and distribution resulting from a projected week-long Yellowstone eruption using wind fields for different seasons. The bold red line delineates the extent of the Huckleberry Ridge Tuff Bed, a prior eruption; the brown line delineates the extent of Lava Creek B Tuff, another prior eruption. (USGS)

Simulated ash thickness and distribution resulting from a projected 3-day Yellowstone eruption using wind fields for different seasons. The bold red line delineates the extent of the Huckleberry Ridge Tuff Bed, a prior eruption; the brown line delineates the extent of Lava Creek B Tuff, another prior eruption. (USGS)
Jacob Lowenstern, the scientist in charge of the Yellowstone Volcano Observatory and a co-author of the research, noted that the point of the model is aviation safety, as experts tried to get a handle on eruption predictions in the wake of Iceland’s 2010 volcanic eruption.
The updated maps also show that wind fields don’t alter the projected ashfall distribution. “I don’t think people fully appreciated that before this,” Lowenstern said.
The Observatory said on its website that the new model helps dispel some of the rumors surrounding the effects of a potential eruption.
“Lack of reliable information left the door open to speculation and fanciful depictions of the effects of supereruptions, which are easily found on the Internet,” the website noted.
“Results of the new study show that ash accumulation, while widespread and substantial, is far less than in most of these ‘doomsday’ scenarios.”


