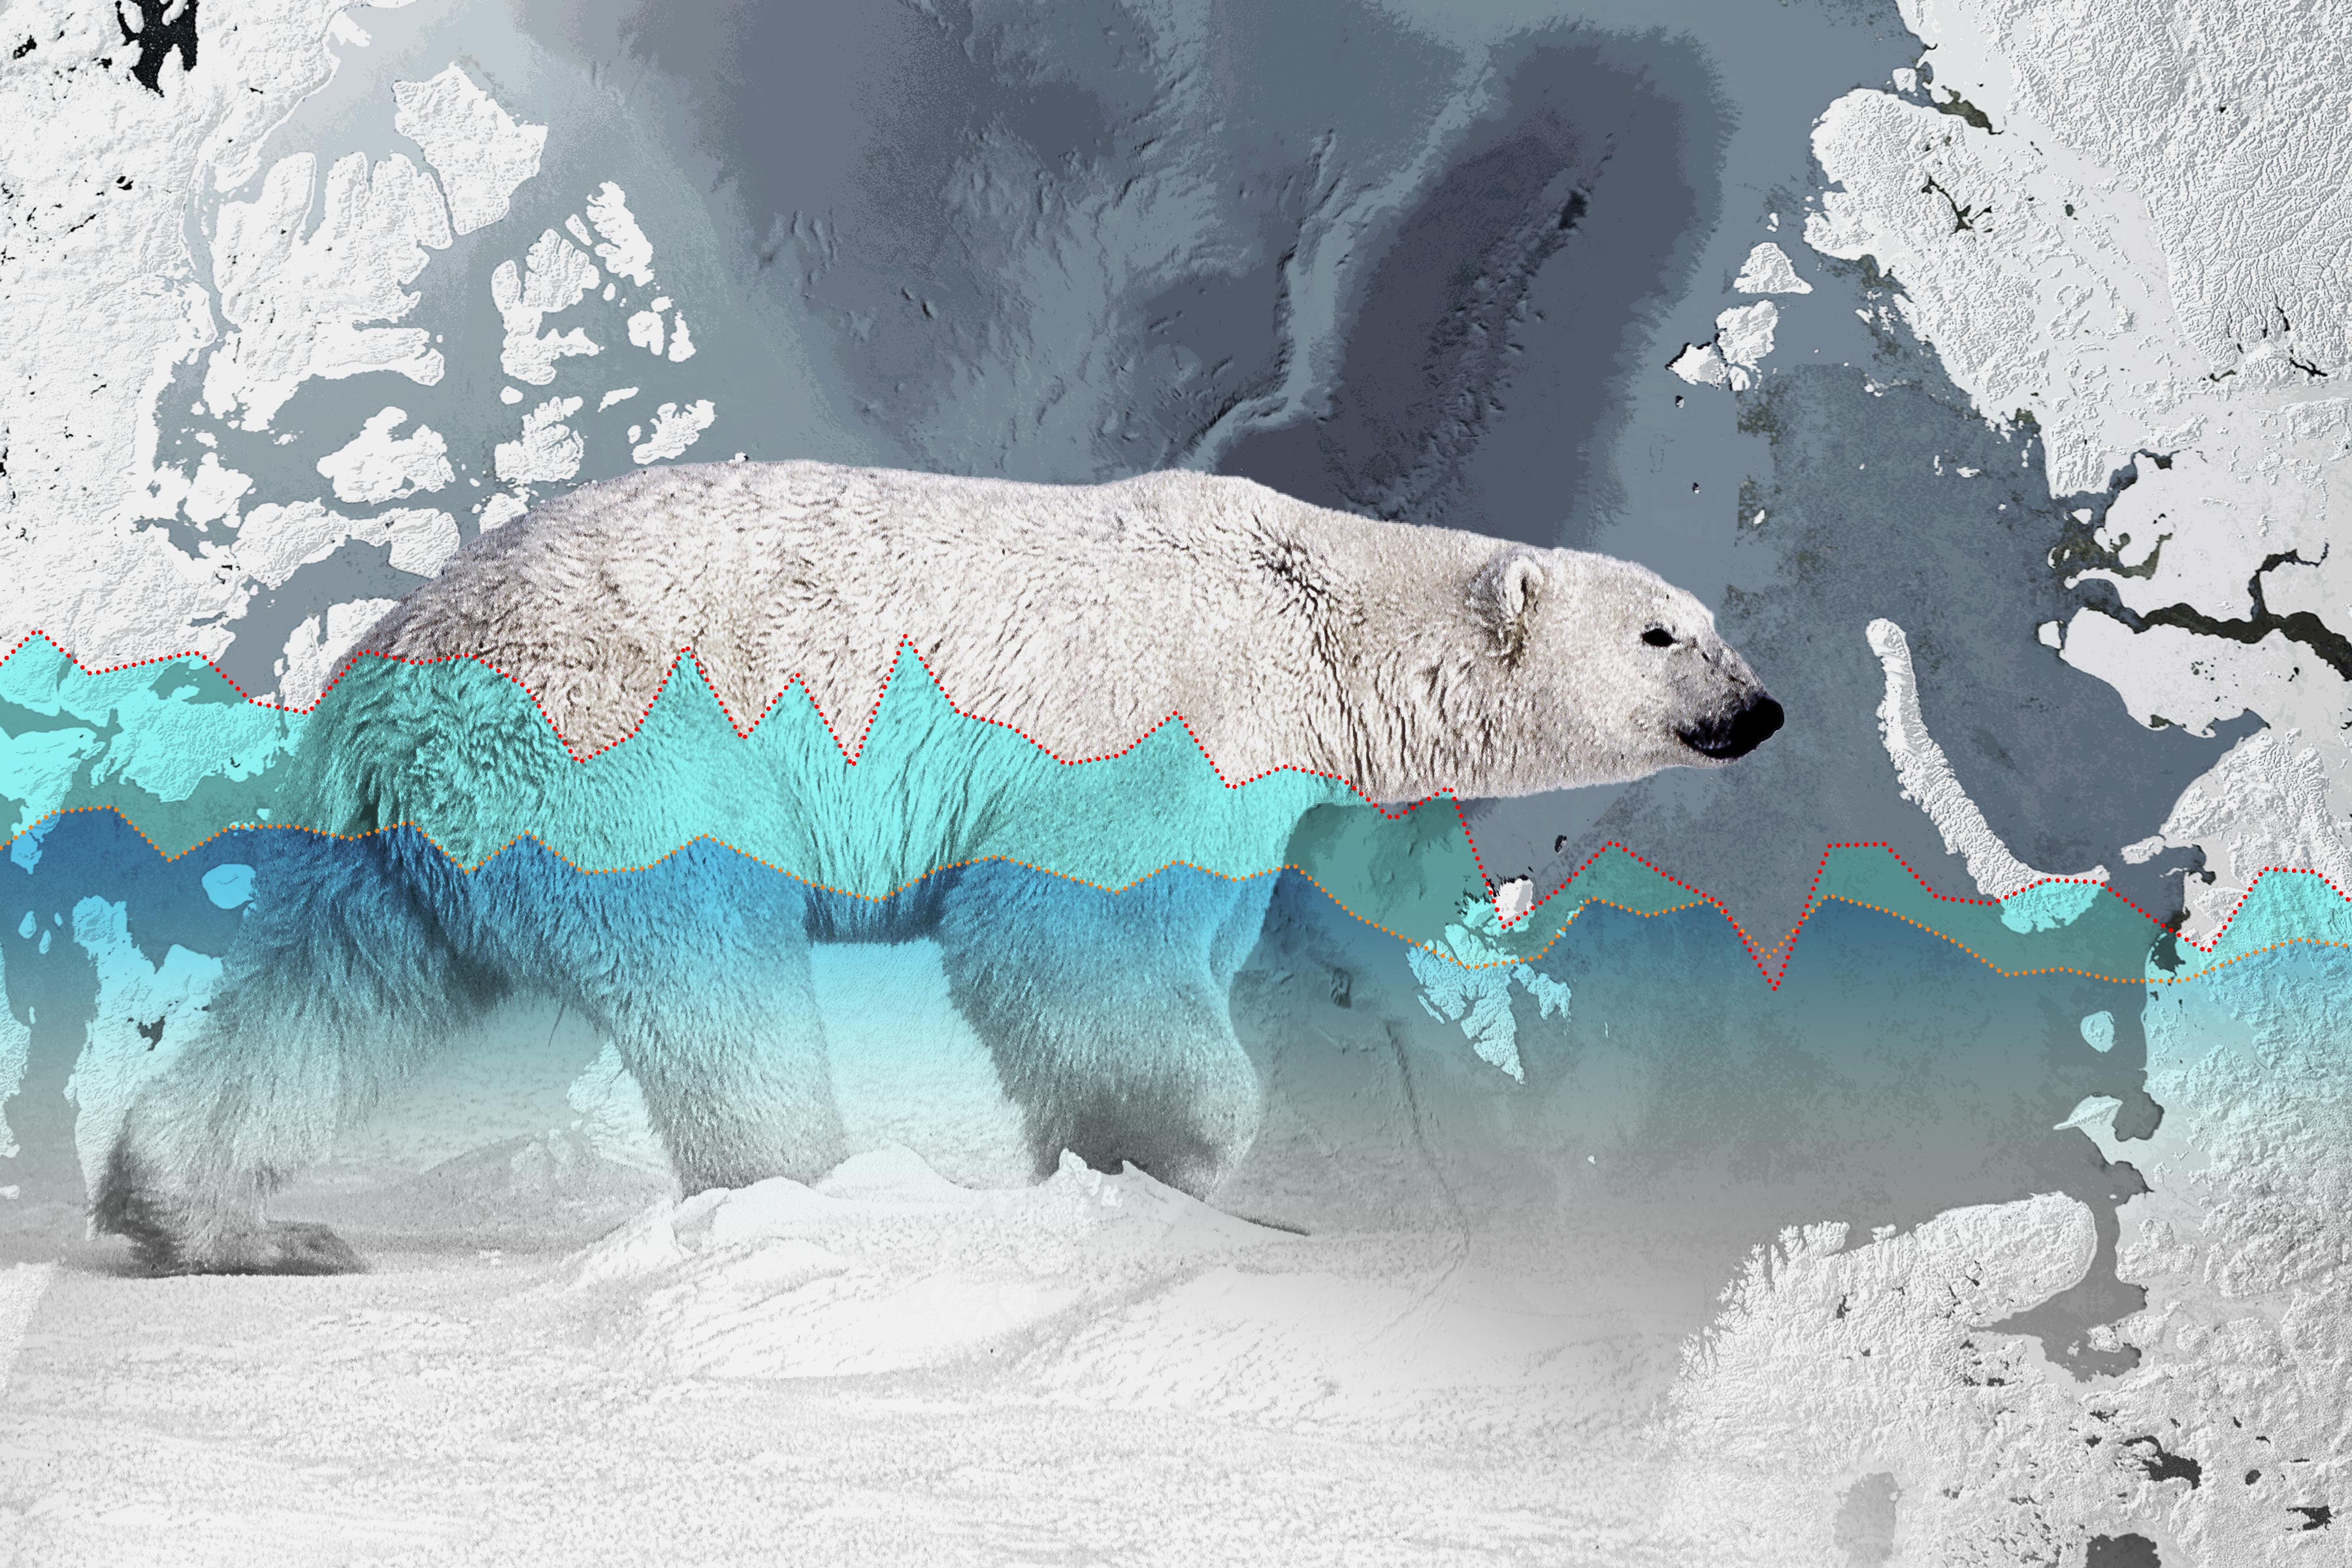
Because of increasing carbon dioxide (CO2) and other greenhouse gas emissions, modeling and simulations predict the Arctic will be without ice during the month of September by 2050.
A similar prediction was made in 2013, but at that time, the prediction was for no ice by about 2033.
![image-5581115](/_next/image?url=https%3A%2F%2Fimg.theepochtimes.com%2Fassets%2Fuploads%2F2024%2F02%2F05%2Fid5581115-GettyImages-625668026.jpg&w=3840&q=75)
Waste coal is unloaded near an unauthorized steel factory in Inner Mongolia, China, on Nov. 3, 2016. The IPCC says that greenhouse gas emissions will cause the Arctic to have an ice-free summer by 2050. (Kevin Frayer/Getty Images)
CO2 and Sea Ice
The National Oceanic and Atmospheric Administration (NOAA) uses data from the National Snow and Ice Data Center (NSIDC) to record Arctic sea ice yearly minimums in September, at the end of the summer melt season. The measurement is based on sea ice extent, which is the square mileage of ice covering the Arctic Ocean during a specified time.![image-5581119](/_next/image?url=https%3A%2F%2Fimg.theepochtimes.com%2Fassets%2Fuploads%2F2024%2F02%2F05%2Fid5581119-GettyImages-1235114291.jpg&w=3840&q=75)
Polar bears were listed as “threatened” under the Endangered Species Act in May 2008, after a significant drop in the Arctic sea ice area. (Ekaterina Anisimova/AFP via Getty Images)
Mr. Geisel said he’s concerned some scientists and policymakers are using “a very precise, almost microanalysis on a very, very macro situation.”
“We’re looking at processes that change over decades, and we’re trying to understand how we’re going to respond this year,” Mr. Geisel said.
![image-5581123](/_next/image?url=https%3A%2F%2Fimg.theepochtimes.com%2Fassets%2Fuploads%2F2024%2F02%2F05%2Fid5581123-Bering-Sea-Ice-Conditions_8-1200x801-1.jpg&w=3840&q=75)
Frank Geisel, an ocean engineer and naval architect, examines sea ice in the Bering Sea. (Courtesy of Frank Geisel)
“If you study the weather systems in the high Arctic, there’s a tremendous high-pressure system that’s well known by weather geeks that sits on the top of the Pole. ... And it shifts, and it’s well known that it shifts positions and thus changes the weather patterns on a decadal frequency—we’re talking 10, 12 years.
“Those are really massive, longer-term processes that all of our technology can’t fully understand.”
Mr. Geisel made the comparison to scientists who closely study hurricanes via satellite imagery and who still aren’t able to fully understand how they'll behave in the near future.
“We have all this imagery, and we can model [hurricanes] very carefully, and they can be modeled down to a scale of about 100 meters,” he said.
“But the mitigation of it as it’s coming to shore isn’t done on a 100-meter basis. It’s done on a 100-mile basis. When a hurricane comes to the coast of Florida, the governor says, ‘Everybody out!’ So, the resolutions of these measurements don’t necessarily equate to mitigation or even an understanding of the consequences.”
![image-5581122](/_next/image?url=https%3A%2F%2Fimg.theepochtimes.com%2Fassets%2Fuploads%2F2024%2F02%2F05%2Fid5581122-GettyImages-1165402826-1.jpg&w=3840&q=75)
A satellite image shows Hurricane Dorian tracking toward the Florida coast in the Atlantic Ocean on Sept. 1, 2019. (NOAA via Getty Images)
Questioning the Data
The NSIDC takes satellite measurements of sea ice and records where ice concentrations are at least 15 percent to understand sea ice extent. NOAA then uses the September measurements to plot sea ice extent over time.![image-5581124](/_next/image?url=https%3A%2F%2Fimg.theepochtimes.com%2Fassets%2Fuploads%2F2024%2F02%2F05%2Fid5581124-4.jpg&w=3840&q=75)
However, the margin of error is significant.
The sea ice area data can be off by up to 1 million square miles when measured in September, according to the NSIDC, compared to March, which has a smaller margin of error.
When plotted on a graph, the decrease in sea ice extent from 1979 to 2023 using March’s more accurate number shows half the rate of decline at 15,000 square miles compared to September’s rate of decline at 30,000 square miles.
Climate models are only as good as the data put into them, Mr. Jensen said.
“The sharp decrease in Arctic sea ice extent before 2007, when the Nobel Prize was delivered to IPCC and Al Gore, was supposed to continue forever. In that light, the predictions were fair,” he said.
“However, when it became clear that the decrease had stopped, they should have stopped such predictions.
![image-5581155](/_next/image?url=https%3A%2F%2Fimg.theepochtimes.com%2Fassets%2Fuploads%2F2024%2F02%2F05%2Fid5581155-1.jpg&w=3840&q=75)
NSIDC data showing sea ice extent trends with CO2 overlay. (The Epoch Times)
“That was, however, difficult politically for them because that would put the whole issue of climate change by CO2 in doubt since the Arctic sea ice decline had been a major argument for the CO2 theory.”
Additionally, satellite imagery of sea ice extent didn’t start in 1979, despite most graphs using that as their starting point.
Using imagery from its old satellites, NASA has pieced together rough estimates of sea ice extent as far back as the 1960s.
Mr. Jensen pointed out that though the satellite images from the 1960s weren’t as accurate as today’s models, they still give an overall picture that doesn’t align with NOAA’s consistently declining sea ice extent claims.
“The extent was possibly lower in some years before 1978. Thus, 1978–1996 levels were possibly a maximum period. Such a max could show up again in the future if CO2 is not the driver of Arctic sea ice extent,” Mr. Jensen said.
![image-5581163](/_next/image?url=https%3A%2F%2Fimg.theepochtimes.com%2Fassets%2Fuploads%2F2024%2F02%2F05%2Fid5581163-2.jpg&w=3840&q=75)
NSIDC data showing trend lines for measurements taken in March versus September months. (The Epoch Times)
“In the Southern Hemisphere since about 1981, sea-ice extent has also varied about a constant level. Between 1973 and 1980 there were periods of several years when Southern Hemisphere sea-ice extent was either appreciably more than or less than that typical in the 1980s.”
Mr. Jensen said “it seems clear” that changes in Antarctic sea ice are driven mainly by El Nino and La Nina.
NSIDC Responds
When asked to comment on Mr. Jensen’s report, NSIDC senior research scientist Walt Meier said it was “nothing new and contains no significant scientific findings” and that the starting year used for the report “was a record low minimum.”![image-5581130](/_next/image?url=https%3A%2F%2Fimg.theepochtimes.com%2Fassets%2Fuploads%2F2024%2F02%2F05%2Fid5581130-Arctic_Sea_Ice_Age.6141.jpg&w=3840&q=75)
A graphic depiction of the change in the Arctic sea ice extent between September 1984 and September 2016. (NASA)
Mr. Meier said the NSIDC only includes data from satellite images from 1979, “because it is the highest quality long-term record. Adding earlier data can provide further context but doesn’t change the conclusions using the data starting in 1979.”
![image-5581132](/_next/image?url=https%3A%2F%2Fimg.theepochtimes.com%2Fassets%2Fuploads%2F2024%2F02%2F05%2Fid5581132-GettyImages-466913819.jpg&w=3840&q=75)
A boat skims through the melting ice on the western coast of Greenland on Aug. 28, 2008. Overall, the NSIDC’s 45-year data trend shows that Arctic sea ice extent has remained relatively steady, with the majority of its decline occurring between 1997 and 2007. (Steen Ulrik Johannessen/AFP via Getty Images)
When asked why we haven’t seen a downward sea ice extent trend commensurate with increasing CO2 ppm—if CO2 is the primary driver of sea ice decline—Mr. Meier said: “Greenhouse gas emissions affect sea ice, and climate in general, as a long-term ‘thumb on the scale.’
“There is always variability in the climate, so we expect ups and downs. Global temperatures do not rise steadily each year—other factors, such as El Nino or La Nina—play a role as well. But greenhouse gasses add a little extra ‘fuel’ each year.”
The sea ice extent increased by an average of 33,700 square miles per day, “markedly faster than the 1981 to 2010 average of 24,700 square miles per day,” the report states.