NEW YORK—Electricity powers the subway rides of millions of New Yorkers every single day, but few give a thought to where this electricity comes from or how it gets to the trains.
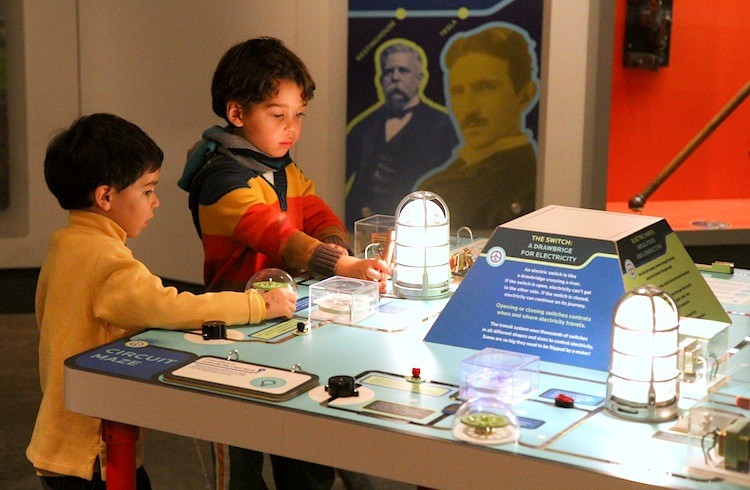
“Electricity,” a new exhibit at the New York Transit Museum, covers all aspects of electricity and the subway system, including the origins of electric rail, where New York’s electricity comes from, and how that electricity gets transmitted over long distances.
“It’s our first time incorporating science,” said Regina Asborno, the museum’s deputy director.
Electric Rail’s Origin
Thomas Edison built an electric railway prototype in 1880 in his Menlo Park, N.J., lab. This was the first use of electrified rails to power trains.
“Within a few years, the conversion of New York City’s (NYC) elevated trains from coal-burning steam locomotives was underway,” reads a display. “The city’s subway and railroads were soon to follow.”
The exhibit tells the story of modern components that have replaced obsolete ones. For example, rotary converters, used in NYC’s first subway in 1904 through 1999, have been replaced with silicon diode rectifiers. The display also includes a 1917 Rehostat, or voltage output regulator, made by General Electric, and rotary converter brushes from 1990.
From Power Plant to Train
About 1.8 billion kilowatt-hours of electricity are used to move 1.6 billion subway riders annually. Although this amount seems high, New Yorkers consume energy at approximately a quarter of the national average, notes a diagram.
Origin of New York’s electricity
More than half of New York state’s (NYS) electricity is generated using sources other than conventional fossil fuel, including one-third nuclear power and 20 percent hydro power. In contrast, the United States as a whole uses fossil fuel for 69 percent of its energy, nuclear for 20 percent, and hydro for 7 percent.
A map at the exhibit pinpoints the seven power plants that provide electricity for NYS. Four are natural gas plants (Ravenswood, Northport, Qswego, and Astoria), two nuclear (Nine Mile and Indian Point), and one hydropower (Robert Moses Niagara). Underneath the map are graphs showing the positive and negative aspects of the different types of power plants. Factors listed are land usage, cost, and carbon emissions.
Each source of energy has an interactive exhibit, including wind and solar; a small-scale wind turbine powers a generator, a dam simulates hydropower, and adjustable solar panels are displayed with meters displaying energy output. Nuclear and fossil fuel each have a sizeable diagram. An information box on the nuclear diagram questions whether nuclear is green, saying, “Nuclear power produces very few carbon emissions. However, splitting atoms creates radioactive waste that is difficult to dispose of and can harm humans and the environment.”
Geoff Arkin and his friend Brian were touring the exhibition.
“It’s really cool,” said Brian, “if something happens, I just know I turn on a light and something happens; I don’t know the whole madness behind it.”
“I’ve been coming to this museum since I was a tiny little kid, and they keep changing it up so I keep coming back here,” added Arkin.
They toyed with the conductor and insulation exhibit. “It’s showing you an electric grid is [and] how everything can be connected to each other,” explained Arkin. “Even though your running a pole line, a fan and a light, they’re still all running because of electricity.”